By Nathan Obaid
Some good news for DSAT test takers: you have access to the Desmos graphing calculator throughout the entire Digital SAT Math test, which can help you answer about of 40% the questions! Mastering Desmos is key to maximizing your Math score.
Here are our 3 favorite simple but powerful Desmos SAT Hacks:
1. Solve any equation:
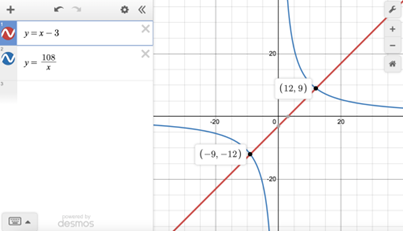
How it works: Graph each side of the equation separately, and then identify the point of intersection. The x-value of the intersection is the solution to the equation—because this is the x-value that makes both sides of the equation equal. (Note that some equations may have multiple solutions or no solutions.)
Example: What is the smallest solution to the equation
x – 3 = 108
x ?
Graphing both sides separately, we see that the solutions to the given equation are –9 and 12, so the smallest solution is –9.
Identify equivalent expressions:
How it works: The SAT often asks you to identify which expression among the answer choices is equivalent to a given expression. It may ask this question across a range of topics, such as quadratic expressions, rational expressions, and radical expressions.
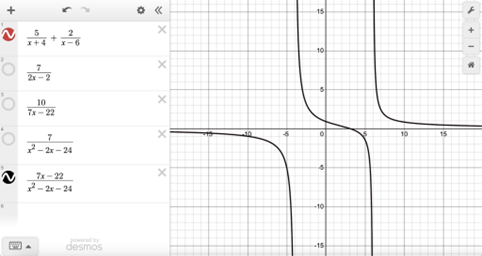
The good news is that, regardless of the topic, you can use Desmos to “hack” the answer! Simply graph the given expression and the expressions in the answer choices: the choice with a graph that matches the given expression’s graph is the correct answer.
Example: Which expression is equivalent to
5
x+4 + 2
x-6 ?
-
- A) 7
2x-2
- A) 7
-
- B) 10
7x-22
- B) 10
-
- C) 7
x2-2x-24
- C) 7
-
- D) 7x-22
x2-2x-24
- D) 7x-22
Only the graph for answer choice D matches the graph of the given expression, so D is the correct answer. It can be helpful to toggle the graphs of the answer choices on and off.
Use a slider:
How it works: Sliders allow you to change the value assigned to a variable other than x and y, which can be very helpful on some of the more advanced questions. When you enter a variable other than x and y in Desmos, the option to “add slider” will usually appear automatically. Once you click on the blue box next to this option, you will be able to click-and-drag to see how changing the slider’s value affects your graph.
Example:
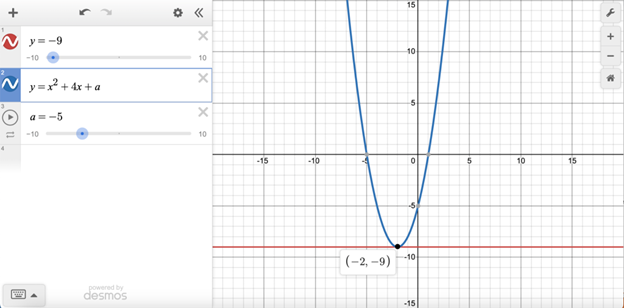
y=-9
y=x2+4x+a
In the given system of equations, a is a constant. The system has exactly one distinct real solution. What is the value of a?
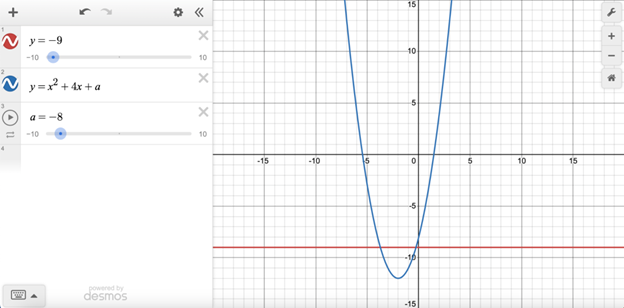
Enter the given system of equations, and then click on the blue box next to “add slider.”
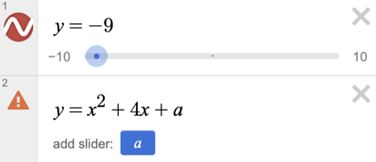
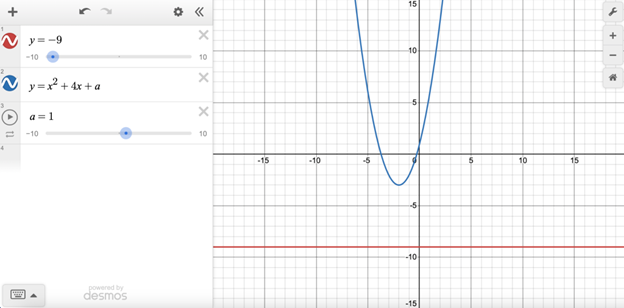
The question tells us that the system has exactly one solution, which means that the graphs’ equations will intersect exactly once. Adjust the slider until you obtain this result. a must equal –5 for the graphs to intersect exactly once, so the correct answer is –5.
